-
Student's T distributionStats/Distribution 2020. 1. 16. 11:31
1. Overview
Visually the Student's t distribution looks much like a normal distribution but generally has fatter tails. fatter tails allow for a higher dispersion of variables and there is more uncertainty. It is a small sample size approximation of a normal distribution. We use the Student's t distribution When it doesn't have sufficient data. Student's t distribution is frequently used when conducting statistical analysis. It plays a major role when we want to do hypothesis testing with limited data since we also have a table summarizing the most important values of its CTF which is T-table

2. Description
2.1 Formula
$$t_{n-1,\alpha}=\frac{\bar{x}-\mu}{\frac{s}{\sqrt{n}}}$$
sample size: n, d.f: n-1
2.2 Statistics
If k > 2:
$$E(Y)=\mu$$
$$Var(Y)=\frac{S^{2}k}{k-2}$$
where k is a degree of freedom
2.3 The t-table
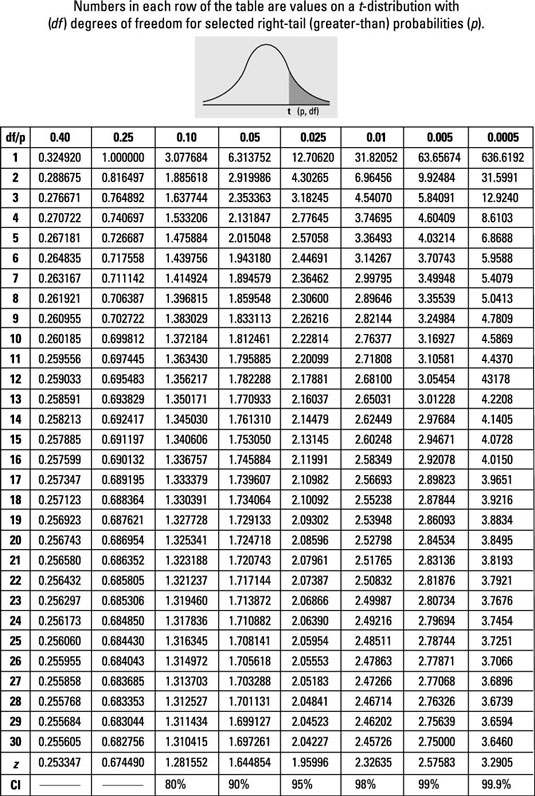
Much like the standard normal distribution table. We also have a student's T table where it is the rows indicate different degrees of freedom. Abbreviated as df while the columns common outputs. Please note that after the 30 rows the numbers don't vary that much. Actually, after 30 degrees of freedom, the teacher autistic table becomes almost the same as the Z statistic as the degrees of freedom depend on the sample. A common rule of thumb is that for a sample containing more than 50 observations we use the Z table instead of the T table.
- Rule of thumb: Reject the null hypothesis when the T-score is bigger than 2
3. Example
Even though we don't have one key piece of information which is the population variance, As the good statisticians that we are we will use the Student's t distribution.

3.1 Fomulus when Population variance unknown and known
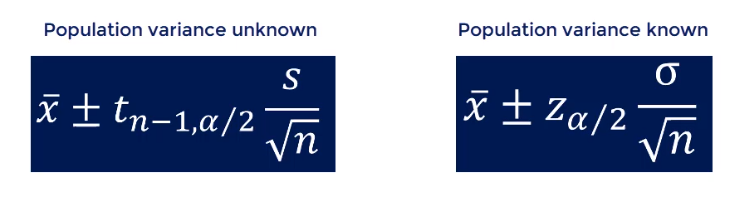
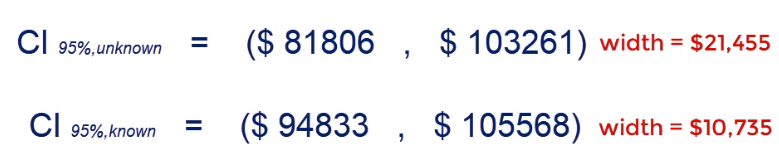
You can clearly note that when we know the population variance we get a narrower confidence interval when we do not know the population variance. There is a higher uncertainty that is reflected by wider boundaries for our interval.
4. Application Example
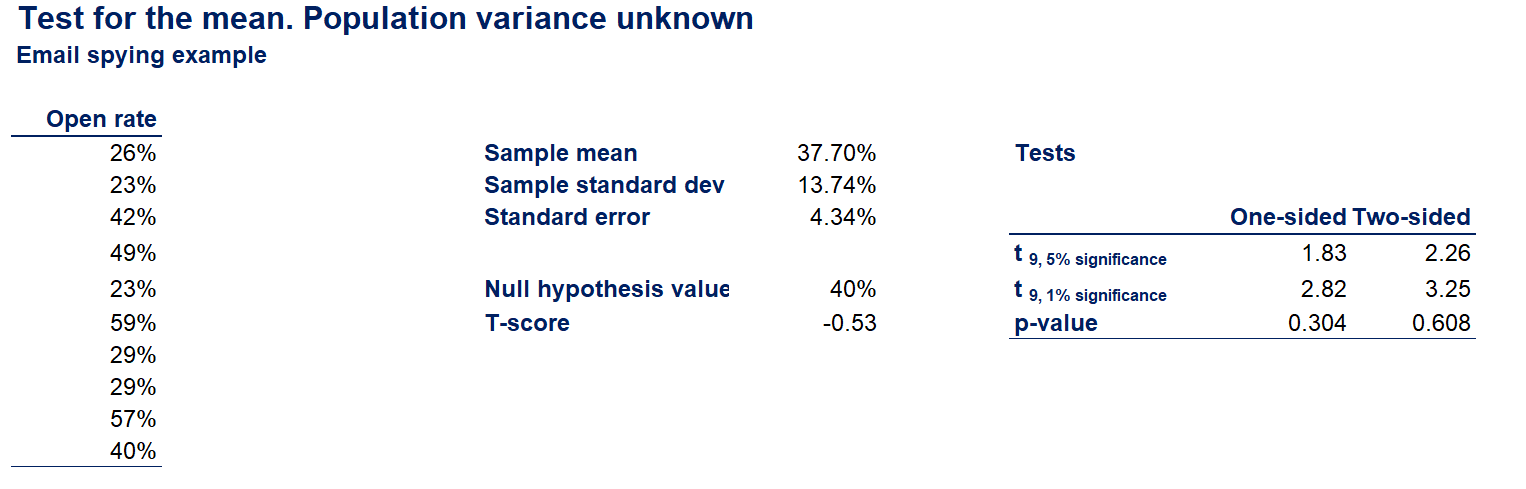
If population variance is unknown and a small sample, the correct statistic to use is the t-statistic.
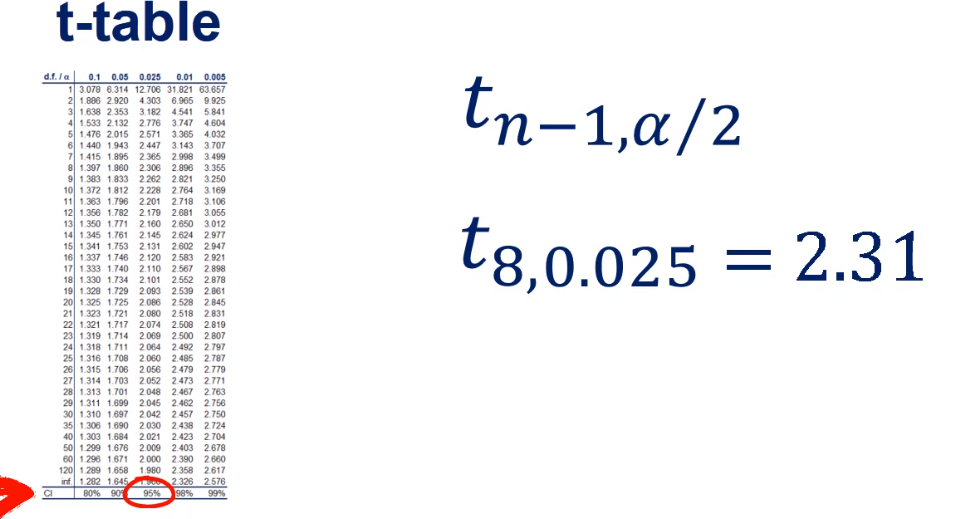
- $$T=\frac{\bar{x}-\mu}{\frac{s}{\sqrt{n}}}T=\frac{\bar{x}-\mu}{\frac{s}{\sqrt{n}}}=\frac{37.70%-40%}{4.34%}=-0.53$$
- degrees of freedom = n - 1 = 9
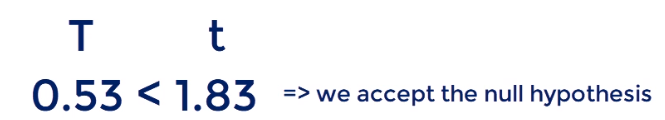
- 0.05 one-sided significance
Accept if the absolute value of the T-score < critical value t
Reject if the absolute value of the T-score > critical value t

Note: The z table has provided the probabilities (to the left) from -3.49 to 3.49. However, the t-table is limited and not as exhaustive as the z-table because the t-distribution varies with the value of sample size (or degrees of freedom). You may find the p-value for the specified t-score with the use of Excel. Just type "=tdist(0.53, 9, 1)" where 0.53 is the absolute value of the computed t-score, 9 is the degrees of freedom, and 1 is the number of tails of the test. You may also use integration in Calculus to get the p-value 0.304.
5. Reference
'Stats > Distribution' 카테고리의 다른 글
Chi-squared Distribution (0) 2020.01.31