-
ElasticsearchDB/Nosql 2020. 3. 3. 19:26
1. Overview
Elasticsearch is open-source analytics and full-text search engine. It’s often used for enabling search functionality for applications. For example, you might have a blog or a webshop for which you want users to be able to search for various kinds of data. That could be blog posts, products, categories, or anything you want. You can build complex search functionality with Elasticsearch, similar to what you see on Google, for instance. This includes auto-completion, correcting typos, highlighting matches, handling synonyms, adjusting relevance, etc.
1.1 Full-text search

Suppose we want to implement searching for a webshop. Besides searching through product names and other full-text fields, we might want to take a number of factors into account when sorting the results. If the products have ratings, we probably want to boost the relevance of highly-rated products. We also might want to allow users to filter results, such as by price range, brand, size, color, etc., and to sort by price or relevance, for instance. Basically Elasticsearch can do everything you will need to build a powerful search engine.
1.2 Query & analyze structured data

You can also query structured data such as numbers and aggregate data, and use Elasticsearch as an analytics platform. You can write queries that aggregate data and use the results for making pie charts, line charts, or whatever you might need. Elasticsearch is not really a business intelligence solution, but you can indeed get a lot of valuable information out of the data that you store within Elasticsearch.
1.3 Analyze application logs and system metrics
An example would be to store logs from applications and various server system metrics and then analyze these, perhaps with alerting set up. You might want to keep track of the number of errors for a web application or the CPU and memory usage of servers, and then show that on a line chart, for instance. This is referred to as Application Performance Management (APM) and is a quite common use case of Elasticsearch and the Elastic Stack.
1.4 Send events to Elasticsearch

Another common thing to do is to send events to Elasticsearch, which can be anything you want, really. Perhaps we are sending sales from physical stores to Elasticsearch, in which case we can analyze which stores sell the most. We can do that with something called aggregations, which you may know from relational databases. But we can do much more than that.
1.5 Excellent at analyzing lots of fo data
Elasticsearch is great at analyzing lots of data.
1.5.1 Forecast future values with Machine Learning

An example of what you can do is to use machine learning to forecast sales based on historical data. That could also be useful for capacity management. Perhaps you are keeping track of how many phone calls are made to a support department, and you want to forecast how much staff you will need in the future. Or perhaps you are keeping track of the number of visitors on a website, and you want to use that to forecast if and when you need to add additional web servers. These were just a couple of examples, so you can of course forecast many other things.
1.5.2 Anomaly Detection

Another thing you can do is anomality detection. If your website normally has 50,000 visitors per day, something is probably wrong if it drops to 5,000, for instance. Monitoring this can be time-consuming, so what you can do instead, is to let machine learning learn the “norm” and let you know when there is an anomality, i.e. when there is a significant deviation from the normal behavior. This is all done for you, so you don’t have to specify rules, thresholds, etc. You can then set up alerts for this and be notified whenever something unusual happens, such as receiving an e-mail or a message on Slack.
2. Description
2.1 How does it work
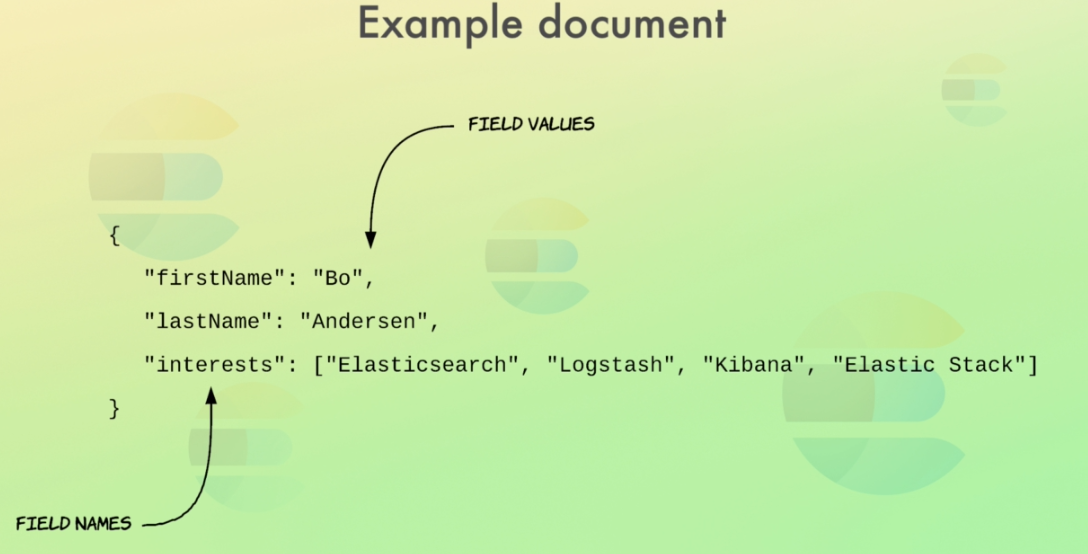
In Elasticsearch, data is stored as documents, which is just a unit of information. A document in Elasticsearch corresponds to a row in a relational database, and can represent a person, a sale, or anything else you want. A document then contains fields, which correspond to columns in a relational database. A document is essentially just a JSON object, so to add a person as a document, you just send a JSON object describing a person to Elasticsearch, such as the example you see.

So the way we query documents, is to use a REST API. The queries that we send to Elasticsearch are also written in JSON, so the API should be fairly easy to use.
Elasticsearch is written in Java and is built on top of Apache Lucene. Elasticsearch has gained a lot of popularity due to its relative ease of use and the fact that it scales extremely well. While Elasticsearch is easy to get started with for simple things, it is still a very complex technology if you want to make use of its full potential. Since Elasticsearch is distributed by nature, it scales very well in terms of increasing data volumes and query throughput. So even if you need to search through millions of documents, searches are still going to be lightning fast!
3. Elastic Stacks

3.1 Kibana
Analytics and visualization platform

3.2 Logstash
A data or event processing pipeline


To receive access log entries, process them, and send the results to Elasticsearch, or any other stash of your choice.
3.3 X-Pack
3.3.1 Security
Adds additional features to the Elasticsearch and Kibana. X-Pack adds both authentication and authorization to both Kibana and Elasticsearch. In regards to authentication, Kibana can integrate with LDAP, Active Directory and other technologies to provide authentication. You can also add users and roles, and configure exactly what a given user or role is allowed to access.
3.3.2 Monitoring
X-Pack enables you to monitor the performance of the Elastic Stack, being Elasticsearch, Logstash, and Kibana. Specifically, you can see CPU and memory usage, disk space, and many other useful metrics, which enable you to stay on top of the performance and easily detect any problems.
3.3.3 Alerting
Alerting is not specific to the monitoring of the Elastic Stack though, as you can set up alerting for anything you want. For example, you might want to be alerted if CPU or memory usage of your web servers go through the roof, or if there is a spike in application errors. Or perhaps you want to stay on top of suspicious user behavior, such as if a given user has signed in from three different countries within the past hour. You can then be notified by e-mail, Slack, or others when something goes wrong.
3.3.4 Reporting
Reports can be generated on-demand or scheduled.
3.3.5 Machine Learning
we can do abnormality detection, such as detecting unusual changes in data based on what the neural network believes is normal. This can be tied together with alerting, so we could have a machine learning job watching the number of daily visits to our website.
3.3.6 Graph
Graph is all about the relationships in your data. An example could be that when someone is viewing a product on an ecommerce website, we want to show related products on that page as well.
3.3.7 Elasticsearch SQL
Query Elasticsearch with SQL. In Elasticsearch, we query documents with a proprietary query language named the Query DSL. This is essentially a JSON object defining the query. The Query DSL is really flexible and you can do everything with it, but it might be a bit verbose at times. What Elasticsearch does, is to translate the SQL query into the Query DSL format behind the scenes, so internally the query is handled the same way after that translation.
3.4 Beats
Beats is a collection of so-called data shippers. They are lightweight agents with a single purpose that you install on servers, which then send data to Logstash or Elasticsearch. There are a number data shippers - called beats - that collect different kinds of data and serve different purposes. For example, there is a beat named Filebeat, which is used for collecting log files and sending the log entries off to either Logstash or Elasticsearch.

Filebeat ships with modules for common log files, such as nginx, the Apache web server, or MySQL. This is very useful for collecting log files such as access logs or error logs.

Another beat worth mentioning is Metricbeat, which collects system-level and/or service metrics. You can use it for collecting CPU and memory usage for the operating system, and any services running on the system as well.
3.4 Summary

The center of it all is Elasticsearch which contains the data. Ingesting data into Elasticsearch can be done with Beats and/or Logstash, but also directly through Elasticsearch’s API. Kibana is a user interface that sits on top of Elasticsearch and lets you visualize the data that it retrieves from Elasticsearch through the API. There is nothing Kibana does that you cannot build yourself, and all of the data that it retrieves is accessible through the Elasticsearch API. That being said, it’s a really powerful tool that will likely save you a lot of time, as you probably won’t have to build your own dashboards from scratch. Then we have X-Pack which enables additional features, such as machine learning for Elasticsearch and Kibana, or management of Logstash pipelines in Kibana. This is all referred to as the Elastic Stack.
4. Architectures
4.1 Intuition
Full-text searches are really good at RDBs. So after looking around online, we decided to go with Elasticsearch, because that seems to be the best tool for the job.
4.2 Architecture
But how do we integrate it with our current architecture? The easiest way is to communicate with Elasticsearch from our application. So when someone enters a search query on our website, a request is sent to the web application, which then sends a search query to Elasticsearch. This can be done with a plain HTTP request, but typically you will use one of the client libraries that are provided for all popular programming languages.

Whenever a new product is added or updated, we should add or update the product within Elasticsearch too, apart from within the database. So essentially we’ll duplicate some of our data. That might sound like a bad idea, but I will get back to why this is actually the best approach.

If you want a dashboard where you can see the number of orders per week, the revenue, etc. We could build our own interface, but we would save a lot of time by using Kibana.

As time passes, the business continues to grow, and we are really starting to see a lot of traffic on the website. Our server is starting to sweat a bit, and we want to make sure that we can handle future growth. A part of this is to handle spikes in traffic and knowing when it’s time to add another web server. To help us with this, we have decided to make use of Metricbeat to monitor system-level metrics, such as CPU usage and memory usage. What we will actually be doing, is to have Metricbeat send data to a so-called Elasticsearch ingest node.
What’s really cool, is that we can actually instruct Metricbeat to configure a dashboard within Kibana.
Apart from monitoring system-level information on our web server, we want to monitor two more things; the access and error logs from our web server. While we do make use of Google Analytics on the website, the access log can provide us with some useful information, such as how long it took the webserver to process each request. This enables us to monitor response times and aggregate the requests per endpoint.

All we need to do is to start up Filebeat, and we will have our logs processed and stored within Elasticsearch, ready for analysis within Kibana. Filebeat has built-in modules for this, which takes care of the heavy lifting in terms of parsing the logs, handling multi-line events such as stack traces, etc., so for simple use cases, we don’t need any configuration to get this to work.

perhaps we even want to migrate to a microservice architecture. Whatever the case might be, we can quickly end up in a situation where events are processed in many different places, making things harder to maintain. Wouldn’t it be better if we could centralize the event processing and have it all done in one place? We can accomplish that with Logstash, which also gives us more flexibility in terms of processing our events than Elasticsearch’s ingest nodes do.
So let’s go ahead and add Logstash to the architecture. We’ll be sending events from our web servers to Logstash over HTTP. Logstash will then process the events however we instruct it to and send them off to Elasticsearch. This way, we keep event processing out of our web application; all they need to do, is to send the initial data to Logstash, and there we will be able to do the rest of the processing. But what about the data from Metricbeat and Filebeat? As for Metricbeat, chances are that we don’t need to do any custom processing of the data, but that might be the case for Filebeat if we are using custom logging formats, or if we want to do some additional processing. If that’s the case - or if we just prefer to centralize things - we can definitely send the data to Logstash for processing.
When a new product is added or a product is modified or deleted. You could leave everything as is, and have your web application update the data in Elasticsearch directly. That’s the easiest approach for sure, but it is also more error-prone, as code errors in the application might break event processing. In the short term, this would be acceptable while migrating everything to Logstash events, keeping everything centralized within Logstash pipelines. Ideally, our web application would only be querying Elasticsearch for data, not modifying any data, so in a perfect world, read-only access should be sufficient. Of course, that might not always be the case in the real world, but it’s a good goal to have nevertheless. Alright, that was an example of a simple architecture evolving over time to become slightly more advanced. That’s a pretty typical example of how you will use Elasticsearch and the Elastic Stack in general, although there are of course variations and other use cases as well.
5. Usages

6. Reference
'DB > Nosql' 카테고리의 다른 글
Data Warehouse and Data Lake (0) 2020.07.10 MongoDB Arbiter (0) 2020.04.10 MongoDB Transactions (0) 2020.02.23 MongoDB vs Casandra (0) 2019.09.30 MongoDB (0) 2019.09.20