-
K-means clusteringMLAI/Clustering 2019. 10. 5. 23:59
1. Overview
k-means clustering is a method of vector quantization, originally from signal processing, that is popular for cluster analysis in data mining. k-means clustering aims to partition n observations into k clusters in which each observation belongs to the cluster with the nearest mean, serving as a prototype of the cluster. This results in a partitioning of the data space into Voronoi cells. k-Means minimizes within-cluster variances (squared Euclidean distances), but not regular Euclidean distances, which would be the more difficult Weber problem: the mean optimizes squared errors, whereas only the geometric median minimizes Euclidean distances. Better Euclidean solutions can, for example, be found using k-medians and k-medoids.
The problem is computationally difficult (NP-hard); however, efficient heuristic algorithms converge quickly to a local optimum. These are usually similar to the expectation-maximization algorithm for mixtures of Gaussian distributions via an iterative refinement approach employed by both k-means and Gaussian mixture modeling. They both use cluster centers to model the data; however, k-means clustering tends to find clusters of comparable spatial extent, while the expectation-maximization mechanism allows clusters to have different shapes.
The algorithm has a loose relationship with the k-nearest neighbor classifier, a popular machine learning technique for classification that is often confused with k-means due to the name. Applying the 1-nearest neighbor classifier to the cluster centers obtained by k-means classifies new data into the existing clusters. This is known as nearest centroid classifier or Rocchio algorithm.
2. Description
2.1 Procedure

Step 1: Choose the number K of clusters
Step 2: Select at random K points. the centroids (not necessarily from your dataset. you could select any points on that scatterplot)
Step 3: Assign each data point to the closest centroid which forms K clusters. Using some measures to calculate the distance between a point to each cluster's representative.
Step 4: Compute and place the new centroid of each cluster.
Step 5: Reassign each data point to the new closest centroid. If any reassignment took place, go to Step 4, otherwise, go to FIN.
2.2 Choosing the right number of clusters
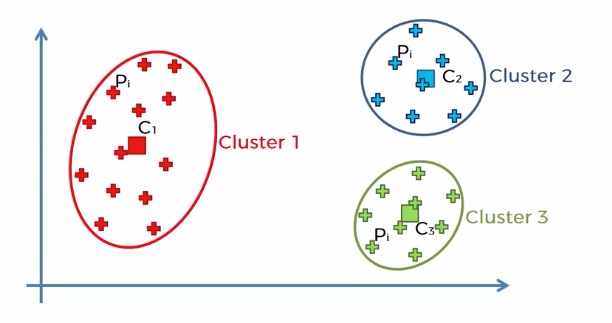
Assuming this two-dimensional vector data set. We need some metrics to determine which number of clusters to be preferable for the data set.
$$WCSS=\sum_{P_{i}\: in\: Cluster\: 1}distance(P_{i},C_{1})^{2}+\sum_{P_{i}\: in\: Cluster\: 2}distance(P_{i},C_{2})^{2}\\+\sum_{P_{i}\: in\: Cluster\: 3}distance(P_{i},C_{3})^{2}$$
Each term of the equation means sum of the squared distance between each element of the cluster and the centroid of the cluster. Actually it's quite a good metric in terms of understanding the goodness of fit between two different K-means clusterings.


as many as we increasing cluster, and end up to 0 when cluster number becomes the same to the number of data set.
2.2.1 The Elbow method

Look for that elbow in your chart where the drop goes from being quite substantial to being not as substantial. And as you can imagine, this method is quite arbitrary. Sometimes the situations are not as obvious.
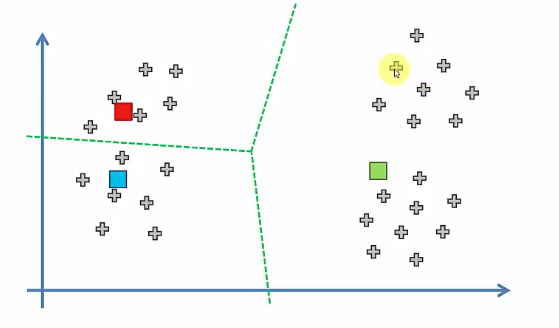
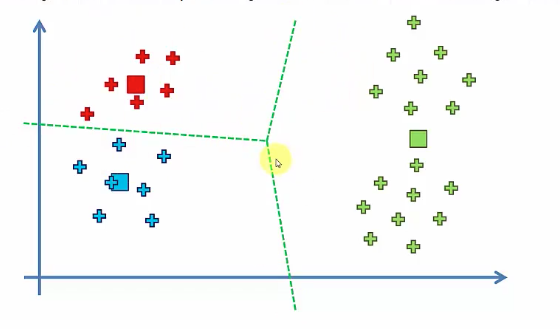
2.3 Random initialization trap
A phenomenon where the selection of the centroids at the very start of the algorithm can potentially dictate the outcome of the algorithm. To solve this problem, K-Means++ come out.
2.3.1 Case 1

2.3.2 Case 2

3. Evaluating the cluster quality
3.1 Inertia
Intuitively, inertia tells how far away the points within a cluster are. Therefore, small inertia is aimed for. The range of inertia’s value starts from zero and goes up.
3.2 Silhouette score
Silhouette score tells how far away the data points in one cluster are, from the data points in another cluster. The range of silhouette score is from -1 to 1. The score should be closer to 1 than -1.
3.3 squared error
$$J(Z,U)=\sum_{i=1}^{N}\sum_{j=1}^{k}u_{ij}\left \| x_{i}-z_{j}] \right \|^{2}$$
4. Example
Step 1: Ignoring how to find optimal cluster number k and assuming an optimal cluster number is 2

Step 2:

Step 3:
In mathematics and data science, there's lots of different type of distances like the one we're using is Euclidean.
It's up to you to decide which distance optimal for the algorithm.

Step 4:
These actual data have a certain weight, whereas before centroids are weightless themselves. Then you need to find the center of mass or the center of gravity of these centroids. And you need to pinpoint it on your scatterplot.

Step 5:


Repeat Step 4 ~ 5 and finally:

4. References
https://en.wikipedia.org/wiki/K-means_clustering
https://towardsdatascience.com/k-means-clustering-from-a-to-z-f6242a314e9a
'MLAI > Clustering' 카테고리의 다른 글
Hierarchical Clustering and Dendrograms (0) 2020.01.22 Clustering analysis (0) 2019.10.06