-
Relationship between MLE and MAPStats 2019. 10. 4. 20:33
1. Overview
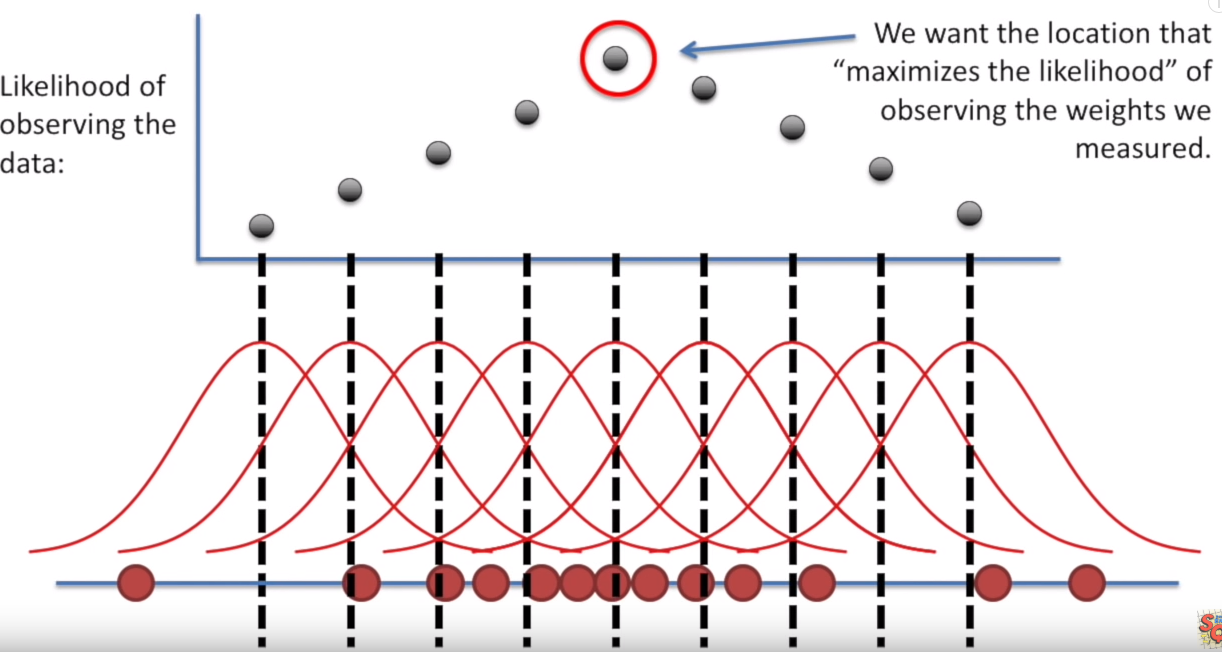
Both Maximum Likelihood Estimation (MLE) and Maximum A Posterior (MAP) are used to estimate parameters for a distribution. MLE is also widely used to estimate the parameters for a Machine Learning model, including Naïve Bayes and Logistic regression. It is so common and popular that sometimes people use MLE even without knowing much of it. For example, when fitting a Normal distribution to the dataset, people can immediately calculate sample mean and variance, and take them as the parameters of the distribution. Although MLE is a very popular method to estimate parameters, yet whether it is applicable in all scenarios? How does MLE work? What is the connection and difference between MLE and MAP? The purpose of this blog is to cover these questions.
2. Description
2.1 MLE
The goal of MLE is to infer Θ in the likelihood function p(X|Θ)

$$\underset{MLE}{\hat{\Theta }} = \underset{\Theta}{argmax } \, p(X|\Theta )$$
in the case where we have more than one experiments (say $X = \left \{ x_{1},x_{2},\cdots ,x_{N} \right \} $) and assume independence between individual training sets, we have the following likelihood:
$$p(X|\Theta )=\prod_{i=1}^{N}\, p(x_{i}|\Theta )=p(x_{1}|\Theta )p(x_{2}|\Theta )\cdots p(x_{N}|\Theta )$$
Using this framework, first we need to derive the log likelihood funcion, then maximize it by making a derivative equal to 0 with regard of Θ or by using various optimization algorithms such as Gradient Descent.
$$\underset{MLE}{\hat{\Theta}} = \underset{\Theta}{argmax } \, \sum_{i=1}^{N}ln\, p(X|\Theta )$$
Because of duality, maximize a log likelihood function equals to minimize a negative log likelihood. In Machine Learning, minimizing negative log likelihood is preferred. For example, it is used as loss function, cross entropy, in the Logistic Regression.
2.2 MAP
Recall, we could write posterior as a product of likelihood and prior using Bayes’ rule:
$$\underbrace{p(\theta |X)}_{A \ posterior \ probability}=\frac{\overbrace{P(X|\theta )}^{Likelihood}\overbrace{p(\theta )}^{A \ piror \ probability}}{\underbrace{P(X)}_{Marginal \ probability}}\propto p(X|\theta )p(\theta )$$
In the formula, $p(\theta |X )$ is posterior probability, $p(X|\theta )$ is likelihood, $p(\theta)$ is prior probability, and p(X) is evidence.
In order to get MAP, we can replace the likelihood in the MLE with the posterior:
$$\hat{\Theta } = \underset{\Theta}{argmax } \, p(\Theta ) \sum_{i=1}^{N}ln\, p(X|\Theta )$$
Comparing the equation of MAP with MLE, we can see that the only difference is that MAP includes prior in the formula, which means that the likelihood is weighted by the prior in MAP.
In the special case when prior follows a uniform distribution, this means that we assign equal weights to all possible value of the Θ. In this case, MAP can be written as:
$$\underset{MAP}{\hat{\Theta}} = \underset{\Theta}{argmax }\left ( const \right ) \sum_{i=1}^{N}ln\, p(X|\Theta )= \underset{\Theta}{argmax } \sum_{i=1}^{N}ln\, p(X|\Theta )=\underset{MLE}{\hat{\Theta}}$$
3. Examples
3.1 MLE
Take coin flipping as an example to better understand MLE. For example, if you toss a coin for 1000 times and there are 700 heads and 300 tails. What is the probability of head for this coin? Is this a fair coin?
First, each coin flipping follows a Bernoulli distribution, so the likelihood can be written as:
$$\prod_{i=1}^{n}\, p^{x_{i}}(1-p)^{1-x_{i}}=p^{\sum_{i=1}^{n}x_{i}}(1-p)^{\sum_{i=1}^{n}1-x_{i}}=p^{x}(1-p)^{n-x}$$
In the formula, $x_i$ means a single trail (0 or 1) and x means the total number of heads. Then take a log for the likelihood:
$$xln(p)+(n-x)ln(1-p)$$
Take the derivative of log likelihood function regarding to p, then we can get:
$$\frac{x}{p}-\frac{1-p}{n-x}=0$$
Finally, the estimate of p is:
$$\hat{p}=\frac{n}{x}$$
Therefore, in this example, the probability of heads for this typical coin is 0.7. Obviously, it is not a fair coin.
According to the law of large numbers, the empirical probability of success in a series of Bernoulli trials will converge to the theoretical probability. However, if you toss this coin 10 times and there are 7 heads and 3 tails. Does the conclusion still hold?
Even though the p(Head = 7| p=0.7) is greater than p(Head = 7| p=0.5), we can not ignore the fact that there is still possibility that p(Head) = 0.5. That is the problem of MLE (Frequentist inference). It never uses or gives the probability of a hypothesis.
Take a more extreme example, suppose you toss a coin 5 times, and the result is all heads. Can we just make a conclusion that p(Head)=1? The answer is no. This leads to another problem. When the sample size is small, the conclusion of MLE is not reliable.
3.2 MAP
Let’s go back to the previous example of tossing a coin 10 times and there are 7 heads and 3 tails. MAP is applied to calculate p(Head) this time. A Bayesian analysis starts by choosing some values for the prior probabilities. Here we list three hypotheses, p(head) equals 0.5, 0.6 or 0.7. The corresponding prior probabilities equal to 0.8, 0.1 and 0.1. Similarly, we calculate the likelihood under each hypothesis in column 3. Note that column 5, posterior, is the normalization of column 4.

In this case, even though the likelihood reaches the maximum when p(head)=0.7, the posterior reaches maximum when p(head)=0.5, because the likelihood is weighted by the prior now. By using MAP, p(Head) = 0.5. However, if the prior probability in column 2 is changed, we may have a different answer. Hence, one of the main critiques of MAP (Bayesian inference) is that a subjective prior is, well, subjective.
4. References
https://www.youtube.com/watch?v=9M9Sd4SVFqI
https://sanghyu.tistory.com/10
https://machinelearningmastery.com/maximum-a-posteriori-estimation/
http://blog.christianperone.com/2019/01/mle/
https://towardsdatascience.com/mle-vs-map-a989f423ae5c
https://www.quora.com/How-can-I-tell-the-difference-between-EM-algorithm-and-MLE
https://stephens999.github.io/fiveMinuteStats/intro_to_em.html
'Stats' 카테고리의 다른 글
Accept-Reject Sampling (1) 2022.07.14 Terminology (0) 2020.01.15 Population, Sample, and Sampling (0) 2020.01.11 p-value (0) 2019.09.27 Metrics: Accuracy, Precision, Sensitivity, Specificity, and F1 score (0) 2019.09.27